

A new financial year is underway, and your accountant has prepared last year's financial statements depicting your business’ performance. It shows a Profit, but what does it all mean?
It is easy to misconstrue a Profit for Profitability. To understand and position your business correctly, it is crucial to understand the difference.
Difference between Profit & Profitability
Profit is an absolute figure, determined by subtracting total expenses from the total revenue of a business. Profitability, however, is a relative measure, determining the scope of a company’s profit in relation to the size of the business. This is primarily measured through two types of ratios; margin and return ratios.
Simply because a business earns a strong nominal profit, does not mean it is highly "profitable". Many business owners expect that increasing profitability is solely related to the level of sales or general activity.
Before we get started, let's look at some ways of measuring Profit performance.
Ratios for Profitability & Margins
Profitability ratios assist to put these considerations into tangible, traceable figures that a business can take and use to track progress. With your financial statements in place and readily available, these ratios are easy to calculate on an ongoing basis when conducting business reviews.
Business objectives should be based on ratios, permitting you to track progress in relative terms over the financial year.
Gross Profit Margin
Gross Profit Margin divides Gross Profit (Sales less Cost of Sales) by Sales Revenue.
-
High margin = higher efficiency of core operations, covering major expenses whilst still providing earnings to the business
-
Low margin = can indicate a high cost of goods sold and a low margin
Operating Profit Margin
Calculated as Earnings before Interests & Taxes divided by Revenue. It is often also used to assess the quality of management within a company.
-
High margin = the business is well equipped to cover fixed costs and interest on obligations
-
Low margin = changing prices to match competitors is more difficult
Net Profit Margin
Calculated as Net Profit after Taxation divided by Revenue.
-
Benefit: all items, including tax, are considered
-
Detriment: one off taxes and outliers are also calculated, potentially skewing data from quarter to quarter.
Let's look an example.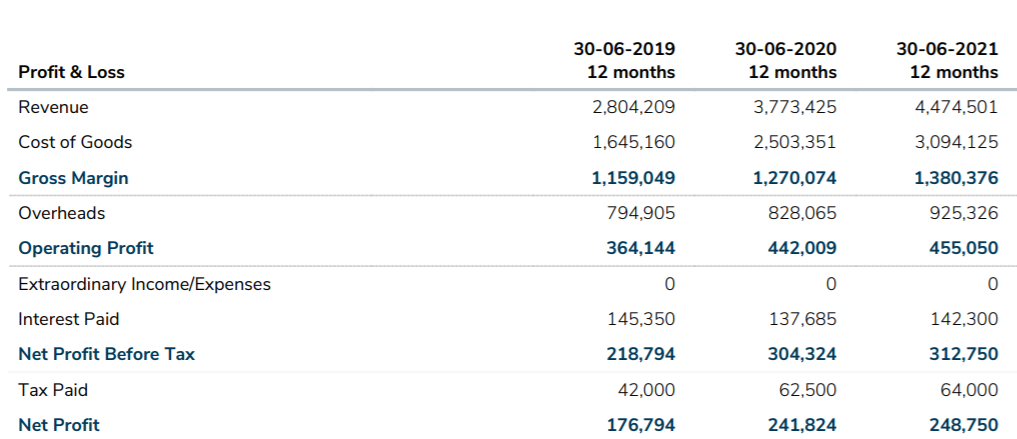
This trading business has been undergoing very strong growth in its sales over a three year period. Whilst impressive, a closer look at the ratios showed the following:
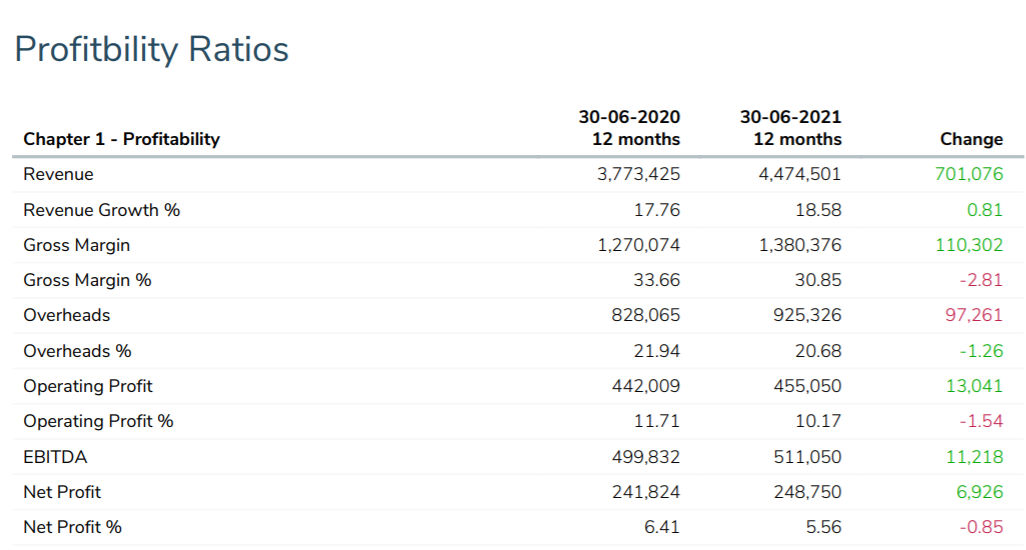
A look at the key ratios, shows us that despite the nominal growth, the key Profitability Ratios are declining (as shown in red above). This means the business is working a lot harder to deliver very similar results.
This is not an uncommon story. As business seek growth, this can be accepting lower sales margins, more fixed cost or just working harder and stretching unused capacity.
Reading the Ratios & Taking Action
In this example, the business has identified the declining and has a set a goal to arrest the declining trends.
One excellent analytical tool is to look at what is called the "Power of One"^ 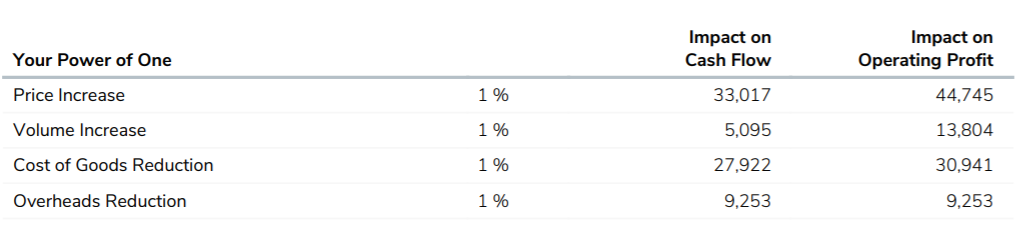
This uses a 1% change in key profit drivers to see the potential impact on Profitability. In this example, the business could see that:
- A price increase has a better impact on Profitability than more sales volume.
- A Cost of Goods reduction is stronger impact than Overheads.
If the price increases by 1% or more, how many clients can the business afford to lose whilst staying profitable? What if clients are retained, and you are required to increase expenses to maintain demand?
With further analysis, it was confirmed that the business had not had a price increase for some time, and its customer service was very good. A price rise of 3% was agreed.